No products in the cart.
Return To Shop
The “Nagios® Connector” add-on enables the WPITCOM Display Box to report frequently the status of different metrics to the Nagios® server. Administrators may define Nagios® notifications or conntect their service department in order to actively react on infrastrucutre or device problems at remote site.
Especially in large footprint installations, infrastructure monitoring is a major issue, to sucessfully manage, often, hundreds or thousands of device installed nationally or internationally on remote sites.
The “Nagios® Connector” add-on is especially designed to solve this challenge. The add-on reports at customizable frequency the status of the remote devices to a central Nagios® server by device name. Several values are checked and reported to the central server.
Please note, that the “Nagios® Connector” also is involved in our IOT – products, like “Temperature Sensors”.
Enabling WPITCOM Display Box Software is simple. By entering the secure URL of the server and it’s token, the setup is nearly finished.
For this purpose, the WPITCOM Display Box Software interactive configuration is used:
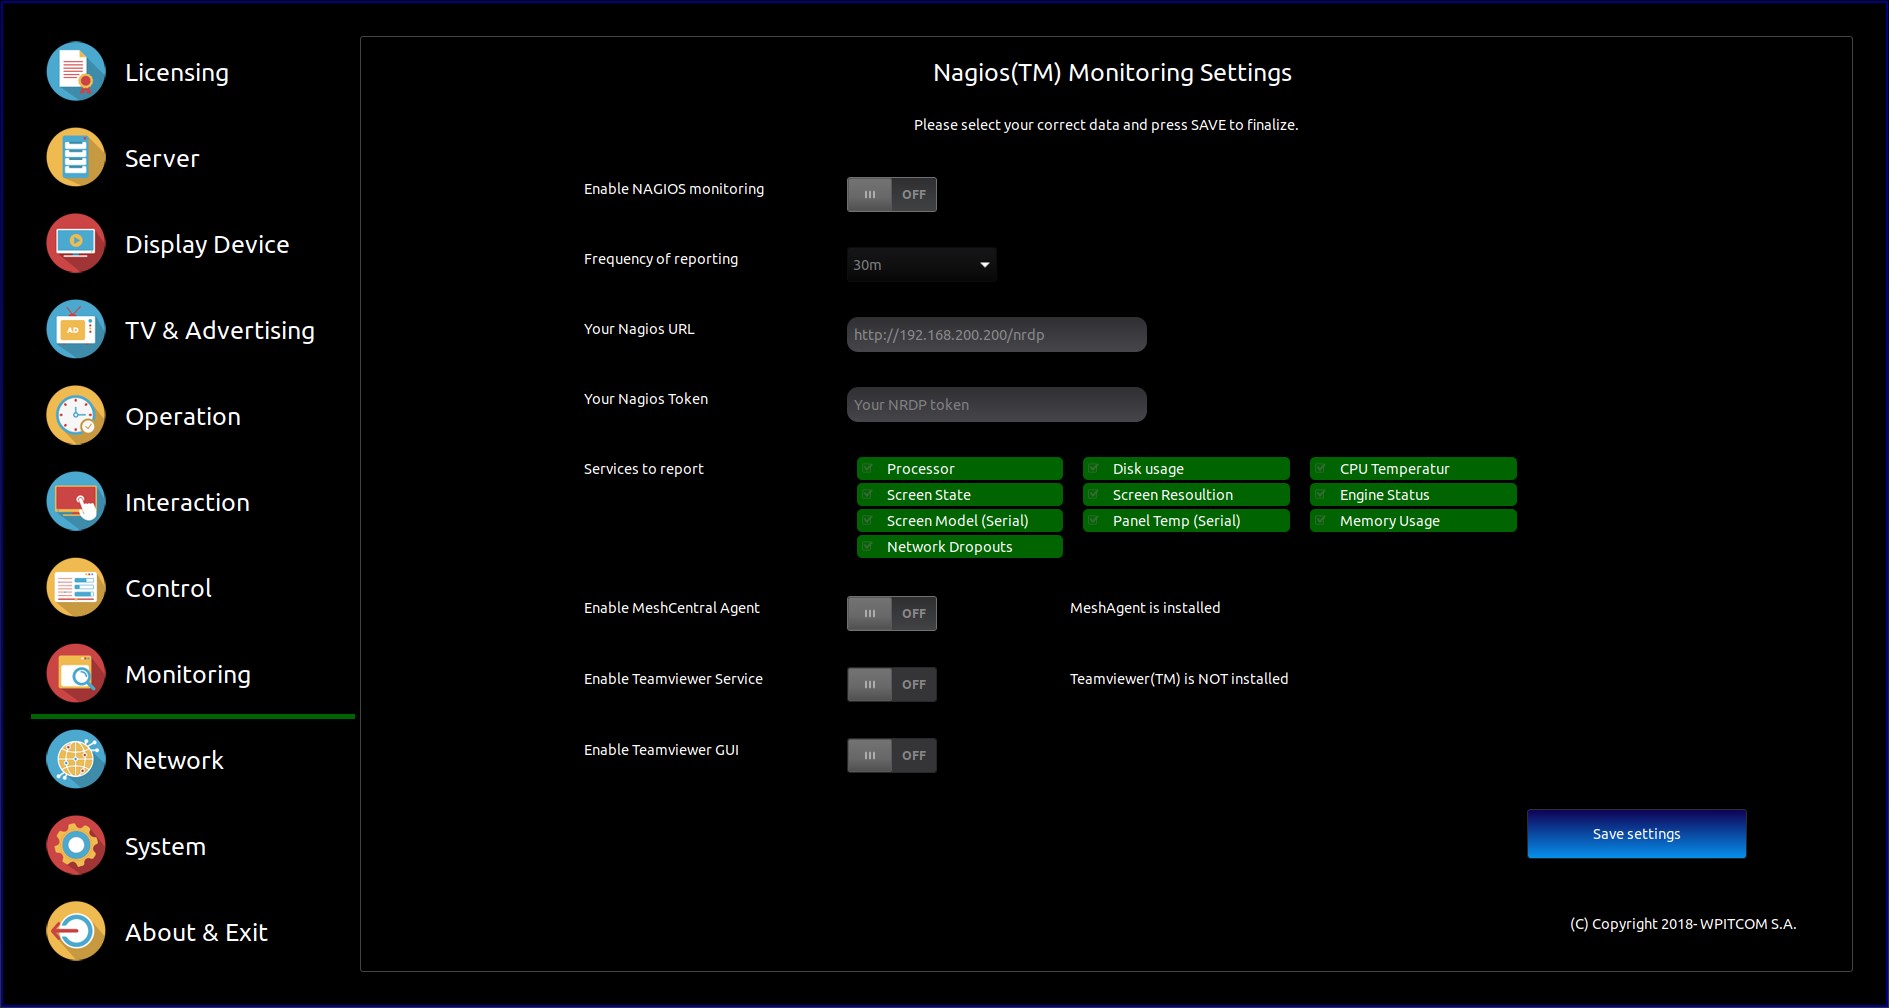
WPITCOM Nagios Connector
The “Nagios Connector” frequently checks the following data at remote site and reports the values to the Nagios® serverm.

WPDB Nagios Services
Some values can only be retrieved if a professional screen system from supported manufacturers is connected via serial RS232 interface, these value currently are the screen model and the panel temperature.
Some of the threshold values for the different metrics can be customized, like screen resolution, disk used and panel temperature. Also here, if the values exceed the defined ranges, the “Nagios® Connector” automatically changes the general state of the Nagios® device to alert status.
For more details, please consider to contact our customer service.
© 2025- WPITCOM Sociedad Anónima
All trademarks mentioned are the property of their respective owners.
All rights reserved.
Content … Visit our Content Platform WPITMEDIACLOUD – Brand Content for Powerful Advertising